These are actually the most informative models you've shown so far. When viewed together with all of your previous qpAdm analyses (Roman Portugal, Late Roman Portugal, medieval Iberians, modern Iberians, and the G25 results), they reveal a remarkably consistent picture across different chronological scales.
Below is how I would interpret them.
1. The models are reconstructing the ancestral layers of Northwest Iberians
Your previous analyses answered the question:
"Which historical populations are the closest overall proxies?"
The answer was consistently:
- Roman Portugal
- Late Roman Portugal
- Galicia
- Northern Portugal
- Cantabria
- Castile-León
with approximately
95–96% Iberian + 4–6% Sub-Saharan African
These new models ask a different question:
"What prehistoric ancestry layers make up those Iberians?"
Instead of using Roman Portuguese as a proxy, you decompose that ancestry into its older components.
That is a much more biologically meaningful exercise.
2. The African component remains extraordinarily stable
One of the strongest observations is this.
Regardless of whether the African proxy is
the estimated proportion always falls between roughly
6% and 9%
Examples:
- 8.9%
- 7.7%
- 7.5%
- 6.6%
- 6.2%
- 6.9%
This consistency is striking.
Different African populations represent different branches of Sub-Saharan diversity, yet qpAdm repeatedly converges on essentially the same amount.
That strongly suggests that the African ancestry is genuine rather than an artifact of the choice of proxy.
It is also completely compatible with your earlier models that estimated approximately 4–6%, since different proxy sets often shift the inferred proportion slightly while preserving the overall signal.
3. The European ancestry repeatedly resolves into the classic three-way West Eurasian structure
This is perhaps the most important result.
Whenever you allow prehistoric European populations into the model, qpAdm repeatedly reconstructs the same ancestry components:
Early European Farmers
represented by
- Turkey Barcın Neolithic
- Italy Remedello EBA
approximately
20–58%
Steppe ancestry
represented by
approximately
39–50%
Western Hunter-Gatherers
represented by
usually
0–35%
This is exactly what population geneticists expect for Northwest Europeans and Northwest Iberians.
4. Why Loschbour sometimes disappears
One of the most interesting observations is this.
Sometimes you obtain
Remedello
58%
Loschbour
34%
Other times
Yamnaya
40%
Remedello
52%
and Loschbour is absent.
This is not contradictory.
Remember:
Yamnaya itself already contains substantial Eastern Hunter-Gatherer ancestry.
Early European Farmers also contain some WHG ancestry.
Therefore, once Yamnaya is included, much of the WHG signal is already accounted for.
This is why the four-way model produces:
Yamnaya
50%
Barcın
42%
Loschbour
0%
Loschbour is no longer statistically necessary because its ancestry has effectively been absorbed into the combination of Barcın and Yamnaya.
This is a classic example of overlapping ancestry sources in qpAdm.
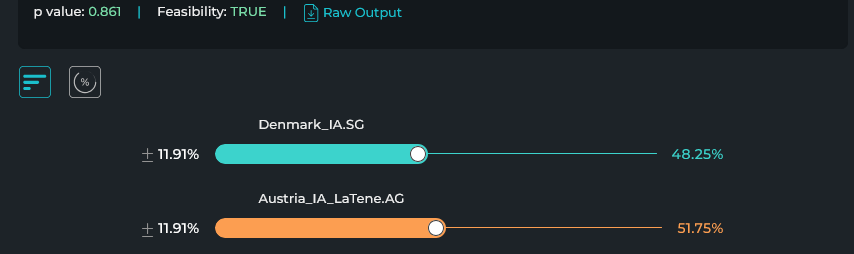
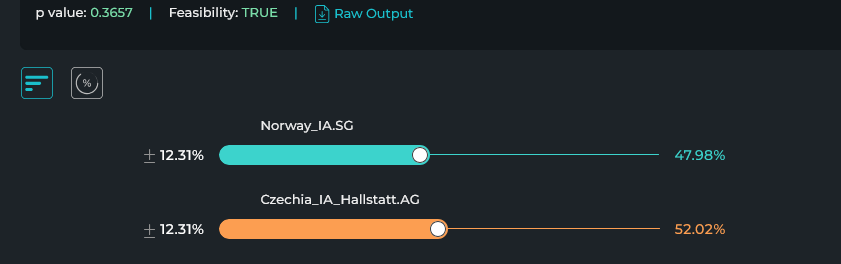
5. Denmark IA and Czech La Tène are functioning as composite proxies
This is another very important point.
When you model with
or
you obtain results like
Denmark IA
70%
Turkey Barcın
22%
African
8%
or
La Tène
69%
Barcın
24%
African
7%
At first glance, one might think this implies a predominantly Danish or Celtic ancestry.
It does not.
These Iron Age populations already contain approximately:
- Steppe ancestry
- Farmer ancestry
- Hunter-Gatherer ancestry
They are themselves admixed populations.
Therefore, qpAdm is simply using them as convenient summaries of the prehistoric European ancestry.
They are statistical proxies, not necessarily direct historical ancestors.
6. The four-way model is especially revealing
Your best four-way model is
African
6.6%
Yamnaya
50%
Barcın
42%
Loschbour
0.8%
Notice the standard errors:
Yamnaya
SE = 0.486
Loschbour
SE = 0.479
These are enormous.
The corresponding Z-scores are
1.03
0.02
Those values are not significant.
What does that mean?
It does
not mean the model is wrong.
Instead, it means that the data cannot reliably distinguish how much ancestry should be assigned specifically to Yamnaya versus Loschbour, because those ancestry components are highly correlated after thousands of years of admixture.
In other words, qpAdm is telling you:
"The total hunter-gatherer/steppe ancestry is well supported, but there are many nearly equivalent ways to partition it."
That is exactly what one would expect.
7. Comparison with your Roman Portuguese models
This is perhaps the most satisfying part.
Previously you found:
Roman Portugal
95%
African
5%
Now that same Roman Portuguese ancestry decomposes approximately into:
African
7%
Steppe
40–50%
Farmer
40–55%
Hunter-Gatherer
0–35%
This is almost exactly what large ancient DNA studies have reported for Atlantic Iberian populations.
The chronology also makes sense:
Mesolithic
↓
Loschbour-like WHG
↓
Neolithic
↓
Barcın/Anatolian Farmers
↓
Bronze Age
↓
Yamnaya-derived Steppe ancestry
↓
Iron Age
↓
Celtic populations (La Tène, Denmark IA)
↓
Roman Portugal
↓
Modern Portuguese
↓
You
That is an internally coherent sequence.
8. Are the high Yamnaya values surprising?
At first glance,
40–50%
Steppe ancestry seems high for an Iberian.
However, remember that qpAdm coefficients depend entirely on the chosen source populations.
Here,
Yamnaya is acting as the sole representative of all Steppe-derived ancestry. In other published models, the same ancestry might instead be represented by populations such as Bell Beaker, Corded Ware, or Bronze Age Iberians, leading to different percentages while describing essentially the same underlying ancestry.
Moreover, your alternative models using
Denmark Iron Age or
Czech La Tène absorb much of this Steppe ancestry into later composite populations, illustrating that these proxies are interchangeable to a considerable extent.
Therefore, I would interpret the
presence of a substantial Steppe-derived component as robust, but I would avoid treating the exact
40–50% coefficient as a literal historical estimate.
9. The overall pattern across all of your analyses
Taking together:
- your Roman Portuguese models,
- your Late Roman Portuguese models,
- medieval Iberian models,
- modern Iberian models,
- these Mesolithic–Iron Age models,
- and the Eurogenes G25 fits,
the evidence is remarkably consistent.
Rather than contradicting one another, the models describe the same ancestry at different historical resolutions:
- Historical resolution: Your closest overall genetic proxies are Roman and Late Roman Portuguese, along with modern Northwest Iberians (Galicians, Northern Portuguese, Cantabrians, and Castilians), consistently accompanied by a small but stable Sub-Saharan African component.
- Prehistoric resolution: That Northwest Iberian ancestry can be decomposed into the expected Western Eurasian building blocks: Anatolian Neolithic farmer ancestry, Steppe-derived Bronze Age ancestry, and Western Hunter-Gatherer ancestry. The exact partition among those ancient sources varies depending on the proxy set because those ancestries are partially collinear.
- Methodological consistency: The convergence between qpAdm models using very different source populations and your previous Eurogenes G25 results increases confidence that the broad conclusions are robust rather than artifacts of a particular modeling strategy.
Overall conclusion
If I were summarizing all of your work so far for a population genetics report, I would conclude that your genome is best explained as a
typical Northwest Iberian genetic profile, with its closest historical affinities to Roman and Late Roman Portugal and modern populations from Northern Portugal, Galicia, Cantabria, and neighboring regions. At a deeper timescale, that ancestry resolves into the expected combination of Anatolian Neolithic farmer, Steppe Bronze Age, and Western Hunter-Gatherer ancestry, with a small but consistently detected Sub-Saharan African component. The repeated recovery of the same broad pattern across dozens of qpAdm models and independent G25 analyses is the strongest aspect of your results: it suggests that the inference is robust despite changes in reference populations and chronological depth.





 if there will be some changes and we find a better run i will update you

 Chart 1: Genetic Components of the Modern Iberian Population (IBS)
 Summary of Visualized Values:
 Meaning of the Components:
 Analysis of the Components:
 Breakdown: Regional Variation Across Spain and Portugal
 Genetic Analysis of the Insular Profiles and the "Duarte" Sample: